| Date | Venue | Fee | |
|---|---|---|---|
| 01 Jun - 05 Jun 2026 | Dubai – UAE | $ 5,950 | Register Now |
| 17 Aug - 21 Aug 2026 | Dubai – UAE | $ 5,950 | Register Now |
| 09 Nov - 13 Nov 2026 | Dubai – UAE | $ 5,950 | Register Now |
| 21 Dec - 25 Dec 2026 | London - UK | $ 5,950 | Register Now |
About the Course
Data Analytics is the science of analysing raw data to make conclusions about information. It has become a crucial aspect of decision-making processes in various industries. It helps companies gain insights from vast amounts of data, allowing them to make informed decisions and improve business operations. Furthermore, it helps a business optimise its performance, perform more efficiently, maximise profit, or make more strategically guided decisions.
Data analysis is the process of extracting information from data. It involves multiple stages, including establishing a data set, preparing the data for processing, applying models, identifying key findings, and creating reports. Data analysis aims to find actionable insights that can inform decision-making.
This 5-day interactive Data Analytics Capstone training course relies on various software tools like R programming Language. The software is one of the most commonly used programming languages in data mining. It is a popular programming language used for statistical computing and graphical presentation. It is an excellent resource for data analysis, data visualisation, data science and machine learning. It provides many statistical techniques (such as statistical tests, classification, clustering and data reduction). It is easy to draw graphs in R, like pie charts, histograms, box plots and scatter plots. It works on different platforms (Windows, Mac, and Linux) and is open-source & free. It has significant community support that has many packages (libraries of functions) that can be used to solve different problems.
Core Objectives
The delegates will achieve the following objectives:
- Understand the basics of the R programming language
- Acquire how to do exploratory data analysis
- Learn how to do correlations & measure associations
- Obtaining the skills of statistical inference & hypothesis testing
- Know how to do data visualisation
- Learn how to estimate linear regression models
- Understand how to make predictions using time series models
Training Approach
The delegates will be taught through learning techniques that ensure maximum understanding, comprehension, and retention of the information presented. The training methods will vary depending on their needs, from front-end to blended learning. It is divided through Information receiving, participation, and Learning by Doing to provide the highest level of apprehension and retention of the presented material. They will be working on case studies and doing a hands-on project, and at the end of the training course, they will be assessed to determine the level of knowledge they have retained.
The Attendees
This training course is designed and appropriate for anyone working in the research field.
Likewise, it will be valuable to the professionals but not limited to the following:
- Data Analysts
- Data Scientists
- Statistician
- Data Engineers
- Project Managers
- Researchers
- Chief Technology Officers (CTO)
- Chief Information Officers (CIO)
Daily Discussion
DAY ONE: FUNDAMENTALS TO “R” PART I
- Getting Started
- Basics
- Matrices and Lists
- For Loops
- Statistics
DAY TWO: FUNDAMENTALS TO “R” PART II
- Plots
- Data Frames
- Reading Data from Files
- Linear Regression Analysis
DAY THREE: EXPLORATORY DATA ANALYSIS
- Sampling
- Variables Types
- Frequency Tables
- Cross Tabulation
- Measures of Locations
- Measures of Variation
- Data Visualisation
DAY FOUR: CORRELATIONS AND INFERENCE
- Correlations
- Measures of Associations
- Inference
- Hypothesis Testing
- ANOVA Test
DAY FIVE: REGRESSION
- Linear Regression
- Multiple Regression
- Logistic Regression
- Time Series Models
- Prediction
Certificate Awarded
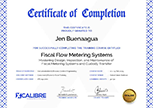
Upon successful completion of this training course, participants will be awarded a Certificate of Completion from XCalibre Training Centre, acknowledging their accomplishment. This certificate serves as a testament to their dedication to developing their skills and advancing their expertise in their respective fields.


